Predicting Loan Application Decision and Grade Using Lending Club Data
Time truly flies when you’re learning data science! I wish I could say that is always synonymous with having fun, but the bootcamp has proven quite challenging at times. Either way, six weeks are in the books, and we’ve already reached the halfway point in the course. We’ve really started to hit a stride with the amount of material we’re covering on a daily basis, and actually absorbing the lectures has seemed easier as time has gone on. With that being said, our last assignment, Project McNulty, was a step up in terms of difficulty compared to the previous two projects. Not only were we required to build a classification model of our choosing, but we had to turn it into a web app and incorporate an interactive visualization as well. Luckily this one was a group project, so there were four of us to distribute the workload between. After much deliberation, we decided to address a classification problem surrounding Lending Club loan application data. Namely, we set out to predict if someone, given their credit history and demographic information, would be accepted for a loan. If they were to be accepted, we also wanted to predict the grade of loan they should expect to receive. As peer to peer lending has become a useful instrument for many in securing financing, we thought it would be both interesting and helpful for potential applicants to see if they should expect to be accepted for their ideal loan.
The first step to this process was building our predictive model. This actually turned out to be pretty straight forward, given that classification has a lot of fundamental similarities to continuous variable predictive models. The main difference is that the target variable(s) (in this case both application decision and grade) is(are) categorical. Most of the tools and techniques, however, are essentially the same. Therefore, after organizing and cleaning the data, we were ready to begin testing models. After trying a lot of different techniques, including support vector machines, naive bayes, and logistic regression, we settled on an extreme gradient boosting model for both classifications. The first model was able to predict application decision with 94% accuracy on a testing set, with 82% precision and 80% recall. Our second model predicted loan grade with an accuracy of 56.7%, which is not nearly as high as the application decision model, but still significantly better than random guessing (about 20% given the five grade outcomes).
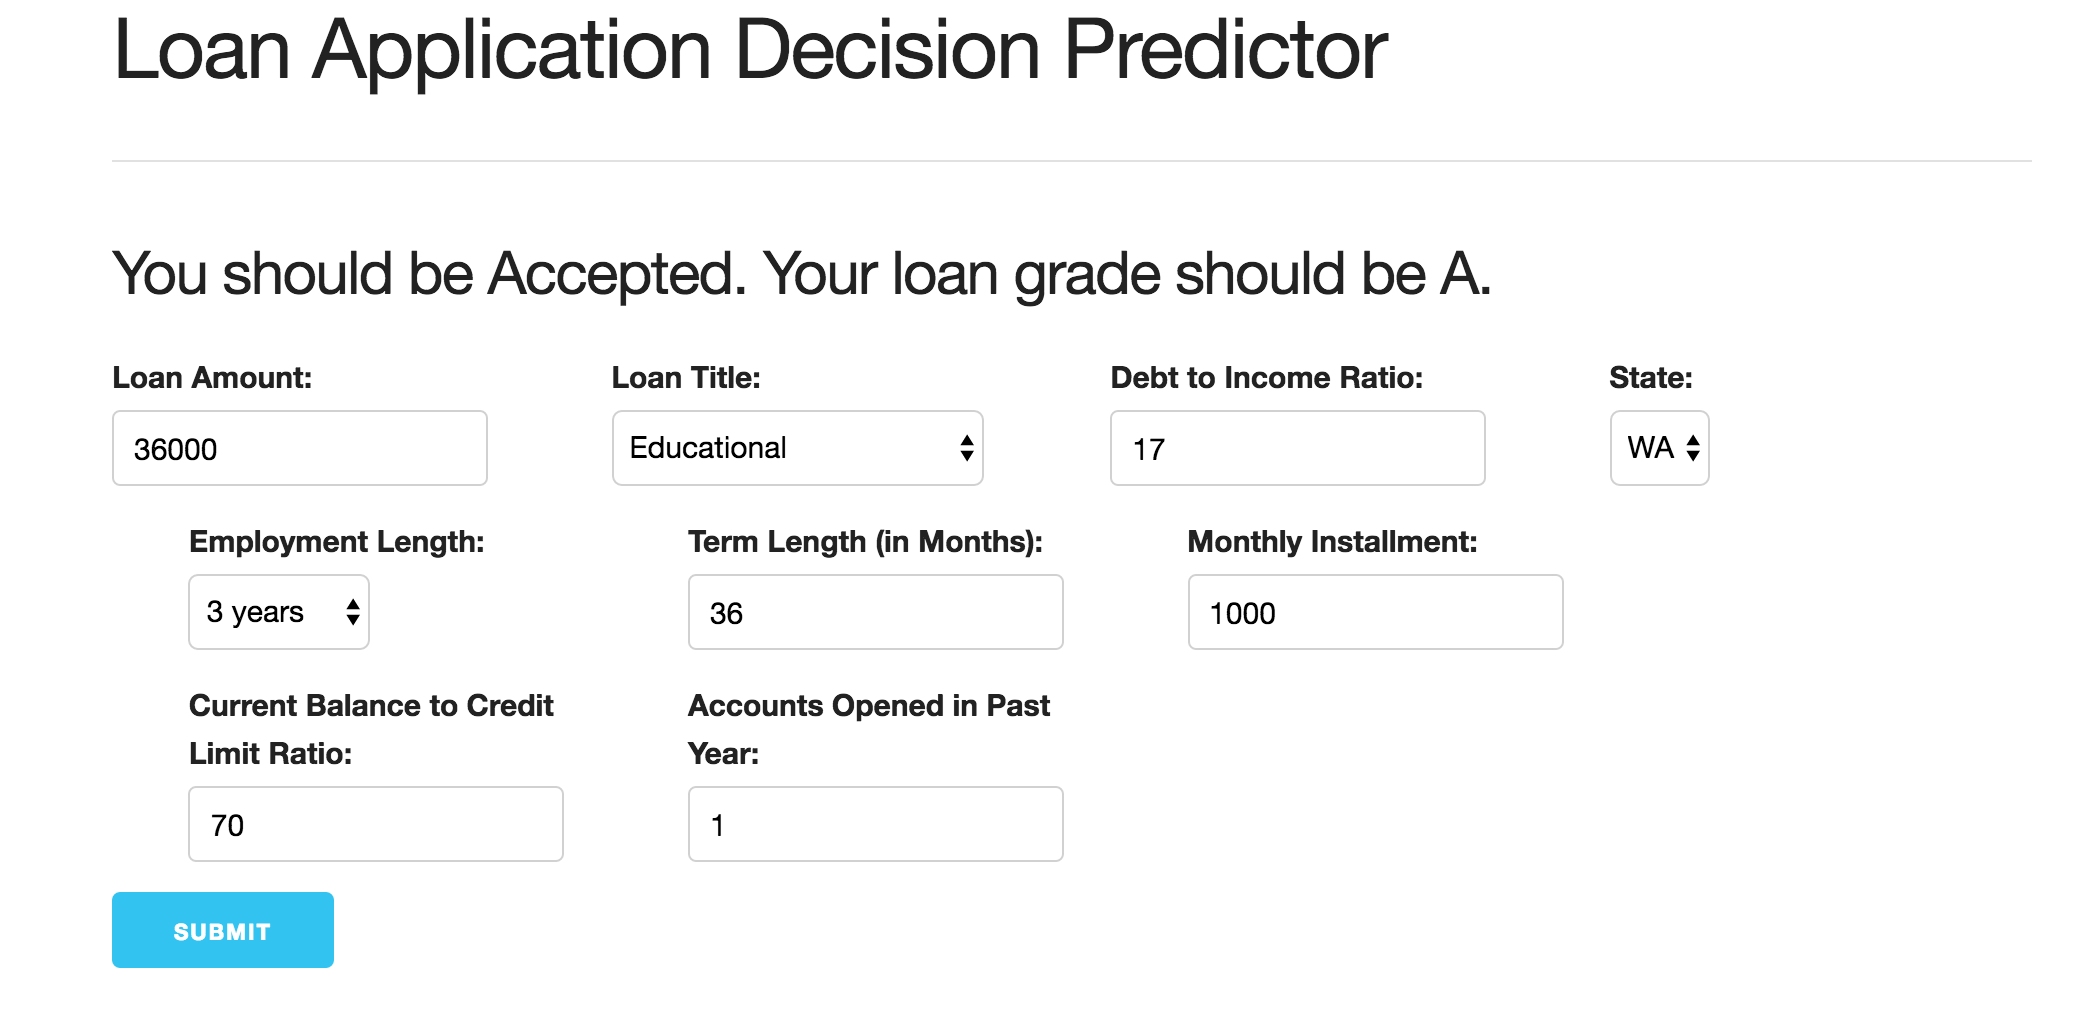
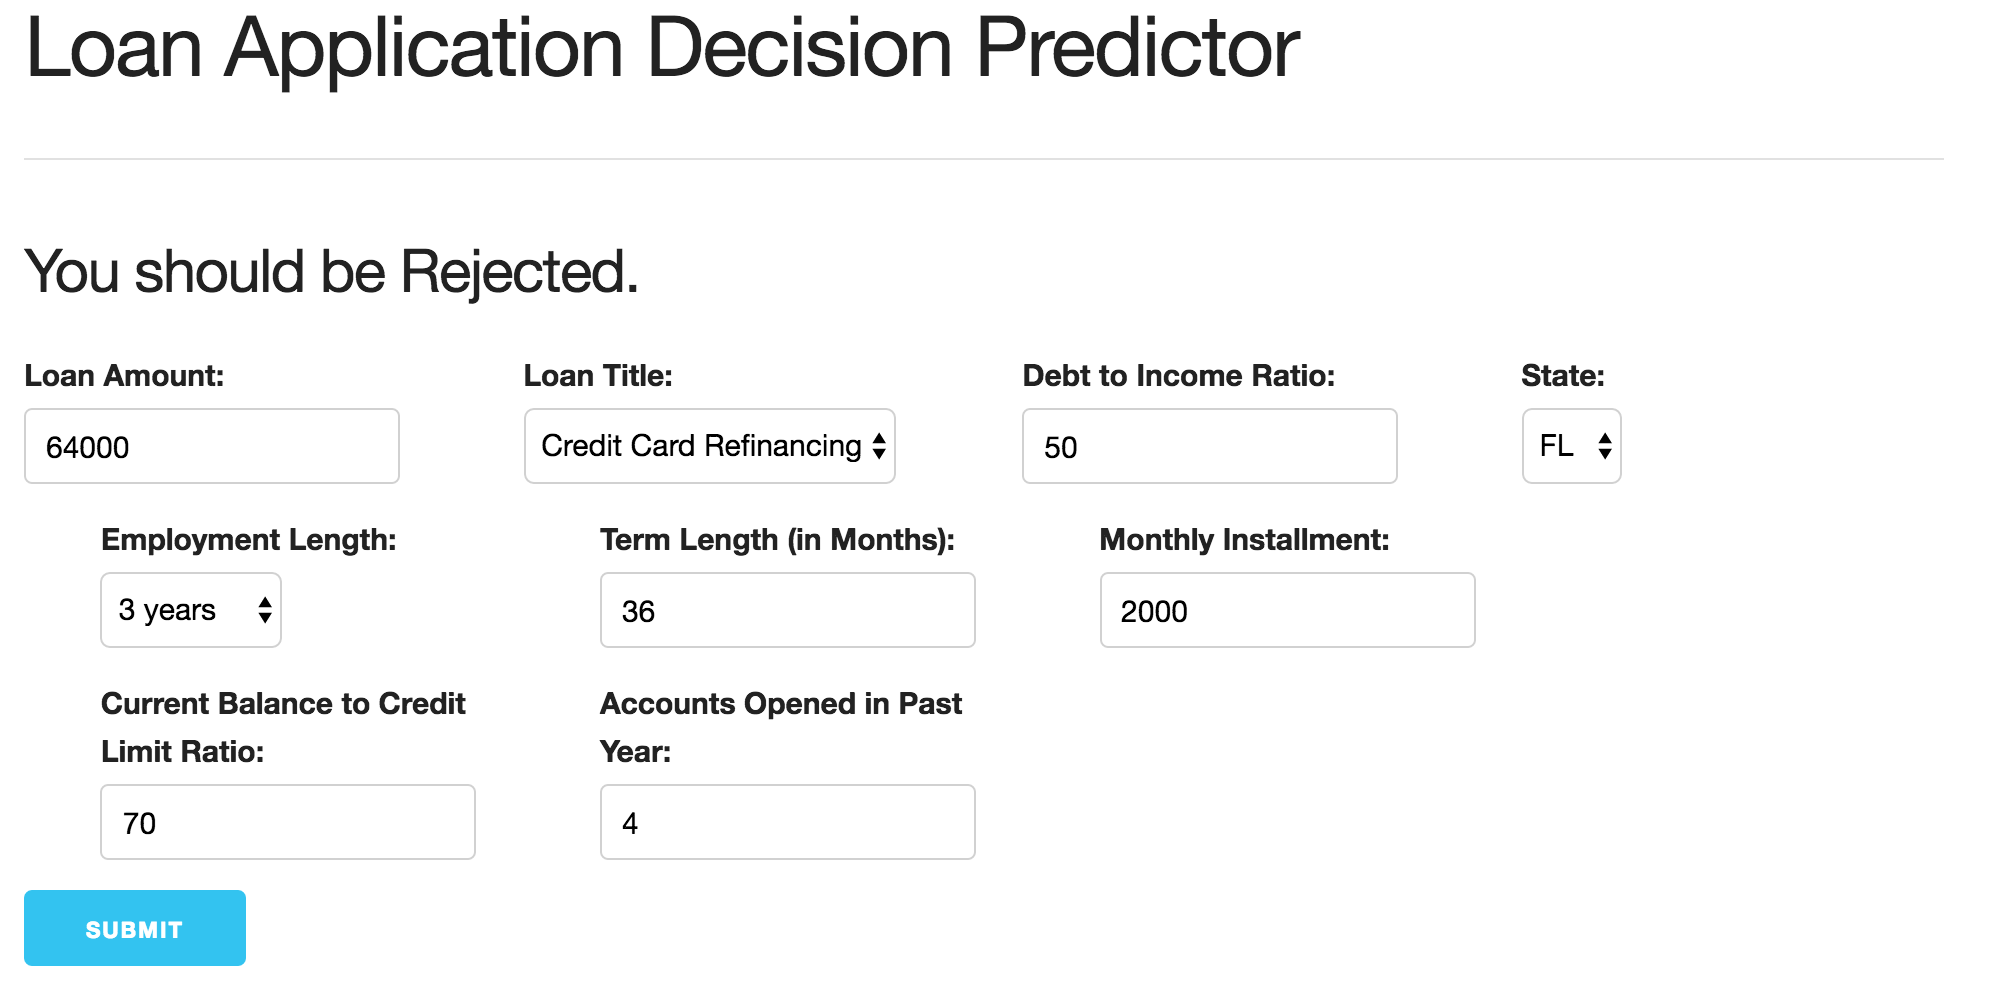
The next step was to build our web app to make our models interactive for a potential Lending Club applicant. We utilized a flask app infrastructure, and were able to get a functioning web app that takes input in terms of both user-typed values and drop down selected categorical values. The user input was then fed to our trained models, and would return a response on whether they should expect to be accepted or not. If so, it would also list their expected loan grade. After hours of tweaking our app through a trial and error process, to get a final product that functioned effectively and provided meaningful results was a really gratifying experience.
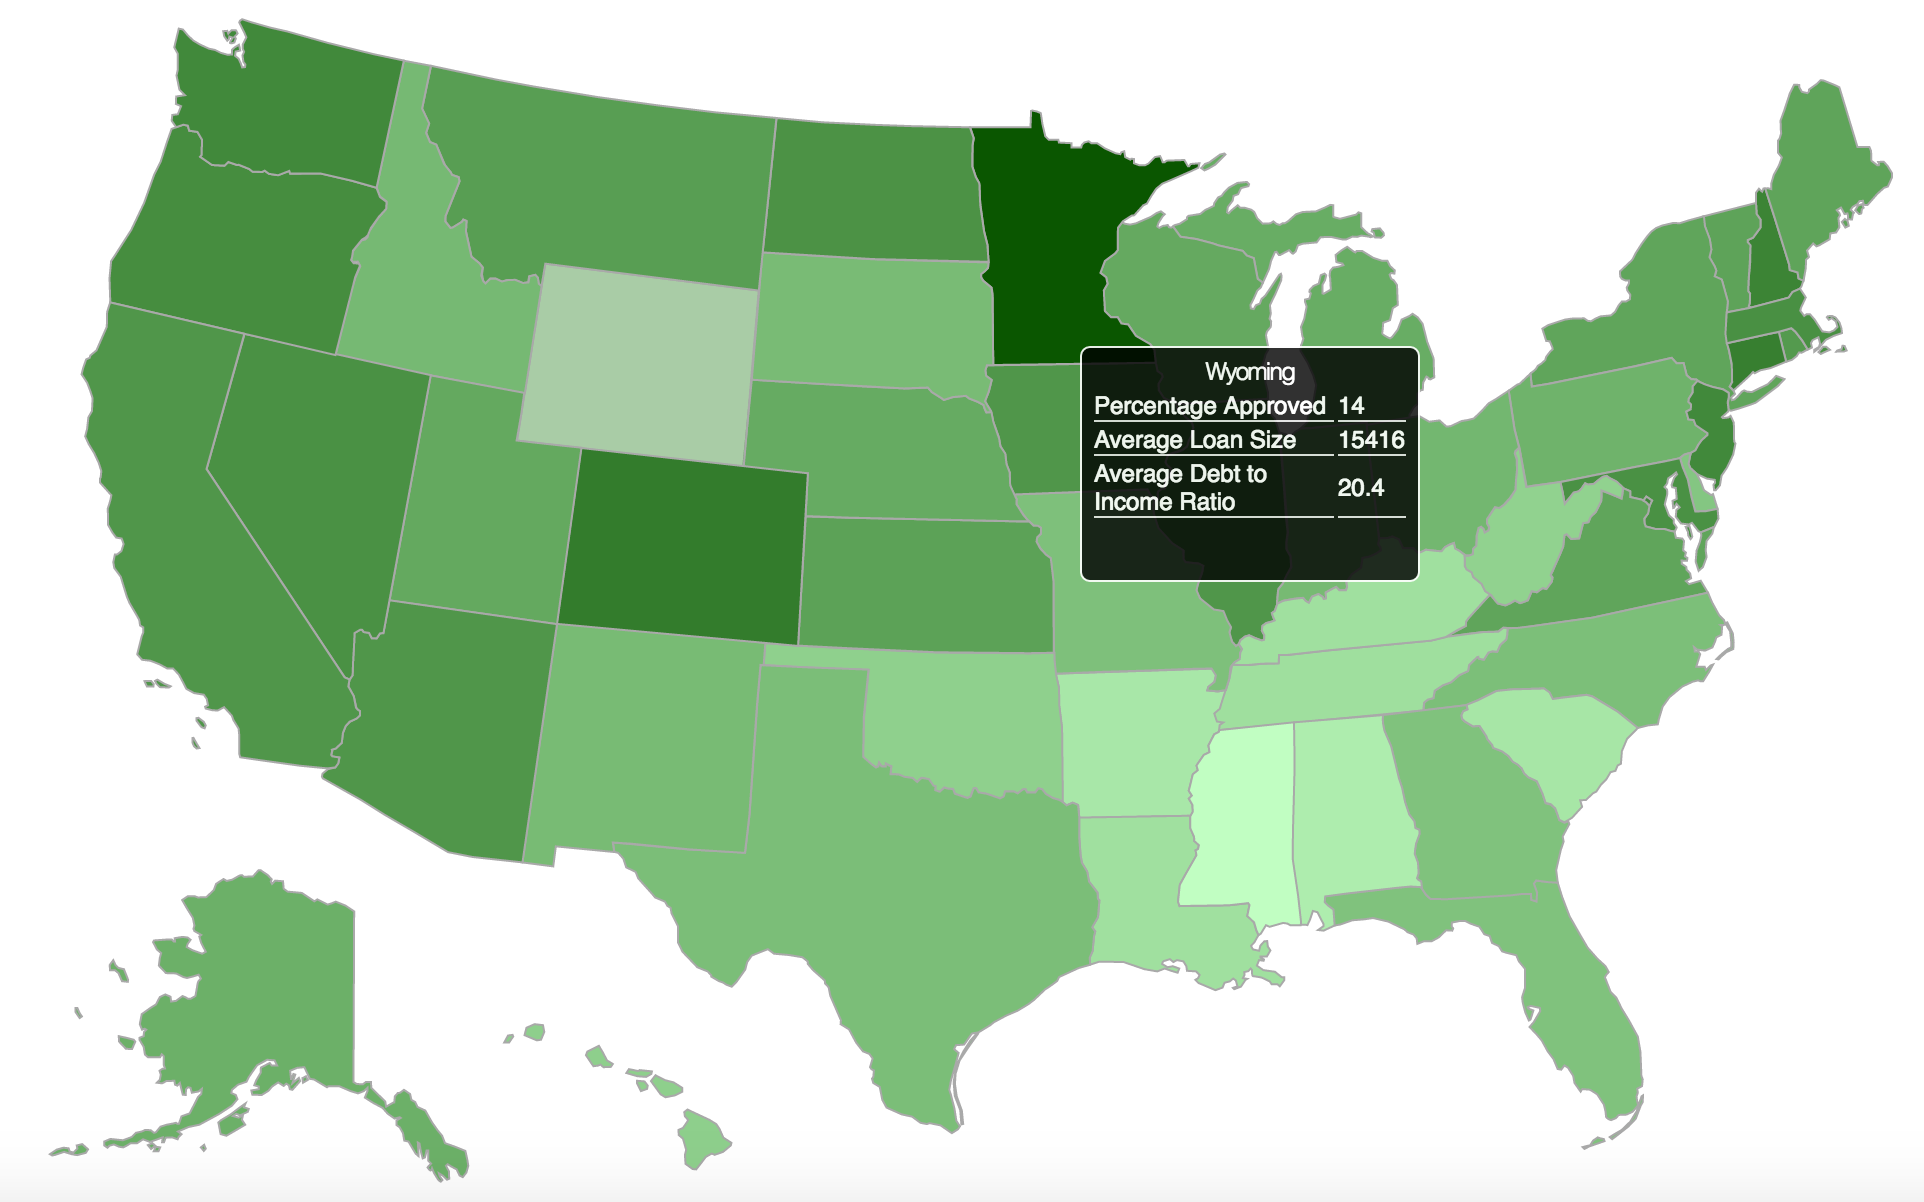
The last step was to incorporate an interactive visualization using the d3.js library. We ended up creating a map to show geospatial state-level loan data. Specifically, we showed the percentage of applicants from each state that were accepted, their average debt to income ratio, and the average amount they applied for. We incorporated a hover over feature so that users of the app could simply scroll their mouse pointer over the state to get a window of all of these statistics. Lastly, we color coated the states in different shades of green depending of the percentage of accepted applicants. The higher the percent that were accepted, the darker the shade of green. This was to allow a visual aid to the users of the app for digesting which states are hot spots for lending club loans.
While McNulty presented a new set of challenges, especially in terms of the web development components of flask and d3.js, overall it was a very enlightening experience into the process of designing an interactive product. Given that our classification models performed significantly better than random guessing, and we were able to build an app that provided useful insights into the world of peer to peer loan applications, I’m satisfied with the end result of McNulty. With that being said, I’m excited to see what’s in store for the coming weeks, and am looking forward to the new challenges, techniques and tools that lie ahead.